Repository navigation
perf: cold build 3x slower than PlatformIO — zccache miss-path include scan dominates CPU #1464
Description

Summary
The nightly Blink benchmark shows fbuild's cold build is about 2.5–3× slower than PlatformIO on the CI runner. The gap is consistent across the last 8 runs in history.jsonl:
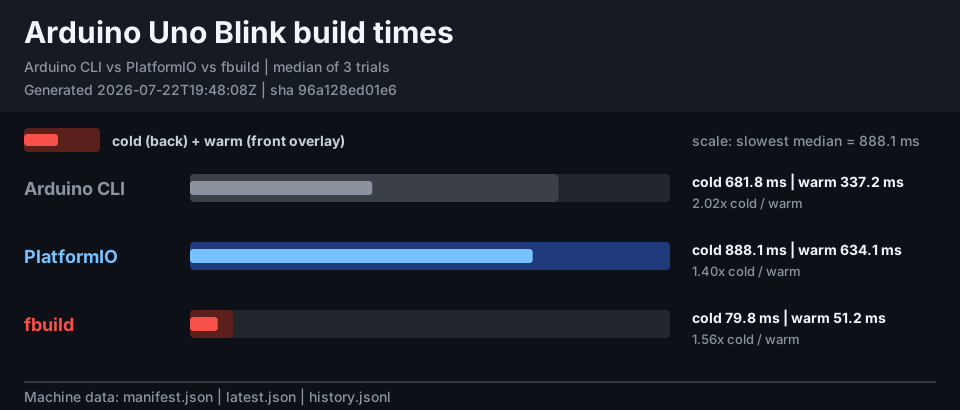
| run (sha 0433e96, 2026-09-25) | cold | warm |
|---|---|---|
| Arduino CLI | 563 ms | 305 ms |
| PlatformIO | 745 ms | 551 ms |
| fbuild | 2111 ms | 46 ms |
The cause is not fbuild's build settings. The embedded zccache's dependency scan on cache misses (zccache_depgraph::scanner::scan_includes_str) uses about 8× more CPU than the compiler itself.
What was ruled out
- LTO / flags: both tools compile the core and link with
-flto, so LTO is on for both. The flags match (-Os -ffunction-sections -fdata-sections -flto). Side note:compile_commands.jsonis a clang-style export (clang++ --target=avr) and omits-flto, which makes the flags look different when they aren't. That's worth fixing separately. - Daemon startup: the benchmark's
fbuild clean cacherestarts the daemon before the timed build, so startup isn't counted. - Parallelism:
effective_jobs= cores × 2, and all 25 core TUs are dispatched within about 300 ms. - Toolchain probes: 25×
-v -E -x c++ /dev/nullplus about 14×--versionrun, but they finish in about 60 ms total.
Evidence
- Raw compile is cheap. Replaying fbuild's 26 compile commands directly with the same avr-gcc 7.3.0: ~340 ms on 4 cores, ~190 ms on 16.
- fbuild takes ~1.5 s for the same work on 4 cores (
taskset -c 0-3, both CLI and daemon pinned). On the same machine and same cores, PlatformIO takes ~1.0 s end to end, including Python startup. This reproduces CI (ubuntu-24.04, 4 vCPU): the CI log showsCompiled 20/25 filesat 1.87 s. - strace (execve): every core compiler process has exited by ~0.65 s after the first dispatch. After that, the daemon runs ~2.4 s with no child processes before it starts the sketch compile (strace-inflated, but proportional).
- perf, release build with line tables (cold build, 16 cores, 1.29 s sample window):
comm:  85.4% tokio-rt-worker (daemon)  |  7.6% cc1plus  1.7% cc1  1.4% as
daemon self-time:
  50.4%  zccache_depgraph::scanner::scan_includes_str
   6.9%  core::slice::memchr::memchr_aligned
   4.4%  CharSearcher::next_match
   2.0%  str::trim_matches
   1.2%  zccache_depgraph::scanner::parse_include_from_line
The caller path is handle_compile::pipeline::store_outcome::scan::collect_compile_scan, the post-miss dependency collection. On a 4-core runner this CPU competes directly with the compiles, which explains the bigger gap in CI (~2.8×) than on a 16-core desktop (~1×).
Likely root cause (zccache)
collect_compile_scan (zccache-daemon-core/.../pipeline/store_outcome_scan.rs) re-runs scanner::scan_recursive over the source and its header tree per TU. This happens either as the static fallback or via augment_system_headers, even though gcc already wrote an -MMD depfile. There is no cross-TU memoization, so every core TU rescans Arduino.h → avr-libc headers from scratch. That's O(TUs × header bytes) of line-by-line string work (join_continuations, build_line_map, strip_comments), and it dwarfs the actual AVR compiles.
Proposed fixes (in zccache, then repin here)
- Trust the compiler depfile when present, and skip
scan_recursiveaugmentation for system headers on a GNU-MMDcompile. - Otherwise, memoize
scan_includesper(path, mtime/size or content hash)across TUs for the whole daemon, so shared headers are scanned once. - Minor:
scan_includes_strallocatesjoinedplusline_mapper file. A single-pass,#-first line filter (skip any line whose first non-whitespace byte isn't#) would cut most of the remaining cost.
Acceptance
- Benchmark cold median for fbuild ≤ PlatformIO's on
ubuntu-24.04. - perf shows the compiler, not
scan_includes_str, as the dominant consumer during a cold build.
Repro
fbuild clean cache bench/blink -e uno --release
fbuild daemon stop
perf record -F 2000 -g --call-graph dwarf -- target/release/fbuild build bench/blink -e uno --release
perf report --comm tokio-rt-worker --no-children --sort sym
(Build with CARGO_PROFILE_RELEASE_DEBUG=line-tables-only CARGO_PROFILE_RELEASE_STRIP=none for symbols.)
Activity
ci: refresh platform-boundary inventory after the running-process 4.1…