Repository navigation
Codex app-server can grow to 30-40 GB when local rollout history is huge #29510
Description

Summary
After updating/restarting Codex Desktop, the codex app-server process grew to tens of GB on a 16 GB macOS machine, causing extreme swap usage and memory pressure. Local evidence points to a pathological persisted rollout/session history interacting with app-server thread listing/resume/read paths.
This report is intentionally sanitized: I am not attaching private transcript contents, only process metrics, file sizes, record counts, crash UI, and public repo code paths.
Environment
- Codex Desktop:
26.616.51431build4212 - Codex app Chromium framework:
149.0.7827.115 - macOS:
26.3(25.3.0), arm64 - Physical memory: 16 GB
- Repo inspected:
openai/codexat5f129a4703ceaf843e1cb6996bbf4a4f21225198
Observed impact
- Activity Monitor initially showed
codexat ~22.4 GB with ~15.34 GB swap. - A later screenshot showed the same
codexprocess at ~39.05 GB with ~32.06 GB swap. - A live
footprint/vmmapcapture while the process was bad showed:codex [690]physical footprint: ~30 GBphys_footprint_peak: ~30 GBMALLOC_SMALL: ~30 GB dirtyvmmap: writable regions total ~30.9 GB; ~28.9 GB swapped out
- OpenClaw/node child processes were much smaller at the time; the growth was in
/Applications/Codex.app/Contents/Resources/codex app-server --analytics-default-enabled.
Crash screen
The same failure shape also produced this Codex crash screen:
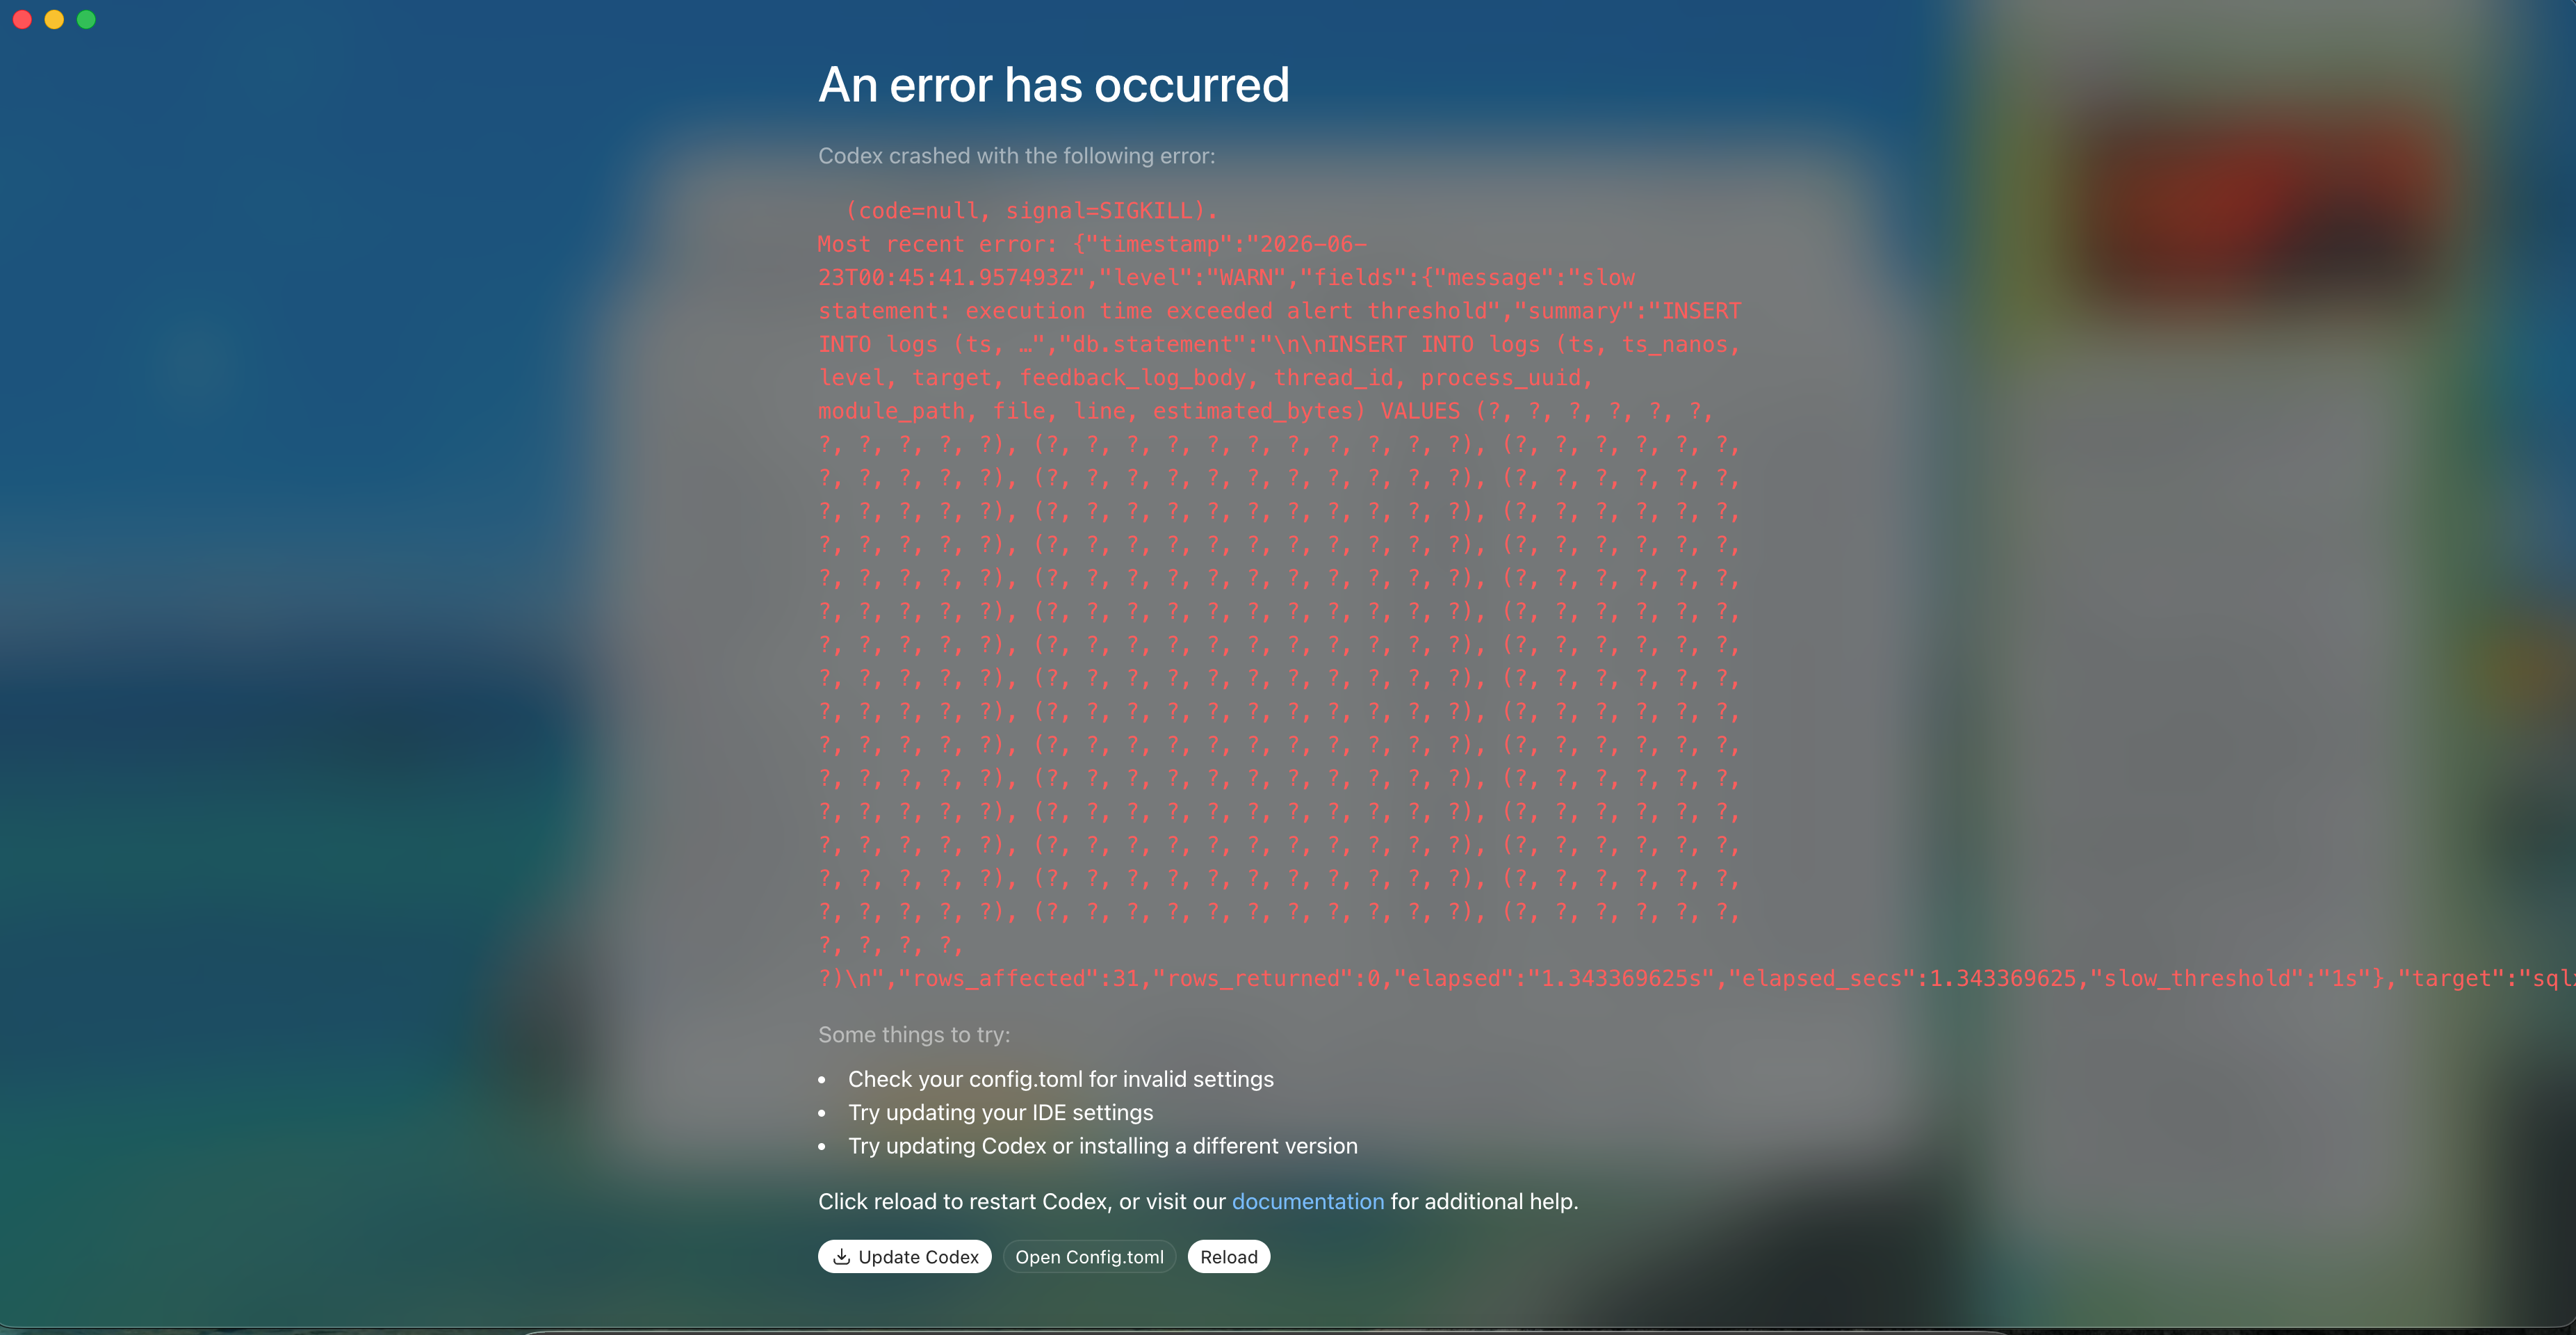
Visible crash details:
Codex crashed with the following error:(code=null, signal=SIGKILL)- Most recent error is a WARN from a slow SQL log insert:
message:slow statement execution time exceeded alert thresholdsummary:INSERT INTO logs (...) VALUES ...rows_affected:31rows_returned:0elapsed: about1.343sslow_threshold:1s
After a tool-level aborted read, the app-server PID had changed/restarted and was back around a few hundred MB RSS, which is consistent with the UI crash/reload path rather than a clean handled error.
Thread-management API repro
The Codex thread-management API can list both problematic threads, but reading the pathological one aborts/crashes:
codex_app.list_threads(query="Restart Openclaw")succeeds and returns:- thread id:
019df821-2a2e-7a01-be45-04b76d73c715 - title:
Restart Openclaw - status:
notLoaded - cwd:
/Users/.../LaterAI
- thread id:
codex_app.list_threads(query="OpenClaw recovery root-fix")succeeds and returns:- thread id:
019ee577-5cd2-75d1-a997-ffb4bf6eeefd - status:
notLoaded
- thread id:
codex_app.read_thread(threadId="019ee577-5cd2-75d1-a997-ffb4bf6eeefd", turnLimit=1, includeOutputs=false)succeeds, although it returns/truncates a very large single-turn summary.codex_app.read_thread(threadId="019df821-2a2e-7a01-be45-04b76d73c715", turnLimit=1, includeOutputs=false)returnedaborted.
This makes the repro more concrete: metadata listing works, a smaller huge recovery thread can be read, but reading the pathological 11.88 GiB Restart Openclaw rollout via the thread-management API aborts/crashes Codex.
Local state correlated with the spike
The local Codex state contains one extreme rollout/thread history outlier:
- Rollout JSONL size:
12,754,101,031bytes (~11.88 GiB) - Line count:
84,643 - Thread DB
tokens_usedfor that thread:1,985,738,719 - Another related recovery thread had
tokens_used = 40,431,073 ~/.codex/sessionstotal size: ~12 GB, dominated by the single rollout file.~/.codex/logs_2.sqlite: ~222 MB plus ~63 MB WAL at time of inspection.
Content-safe sampling of the huge JSONL:
Head sample, first 20,000 lines:
- response_item: 13,922
- event_msg: 5,526
- turn_context: 343
- session_meta: 175
- compacted: 34
token_countevents: 2,779- largest sampled line: ~11.1 MB
Tail sample, last 2,000 lines:
- response_item: 1,502
- event_msg: 467
- turn_context: 17
- compacted: 14
token_countevents: 248- largest sampled line: ~60.9 MB
Suspected code paths
These paths appear capable of loading or scanning large rollout histories without size/record caps.
thread/readwith turns loads persisted history and builds API turns
codex-rs/app-server/src/request_processors/thread_processor.rsthread_read_response_inner->read_thread_view->load_persisted_thread_for_read(... include_turns ...)load_persisted_thread_for_readcallsthread_store.read_thread(... include_history: include_turns ...)- When history is returned, it calls
build_api_turns_from_rollout_items(&history.items).
- Thread store
include_historyloads the entire rollout into memory
codex-rs/thread-store/src/local/read_thread.rsattach_history_if_requestedcallsload_history_items(&path).load_history_itemscallsRolloutRecorder::load_rollout_items(path)and stores all items inStoredThreadHistory.
RolloutRecorder::load_rollout_itemsis unbounded
codex-rs/rollout/src/recorder.rs- It streams lines from
open_rollout_line_reader, parses each line, then doesitems.push(item)into aVec<RolloutItem>with no file-size cap, record-count cap, byte budget, or cancellation/backpressure noted in the inspected code. - On an 11.88 GiB rollout with some 10-60 MB JSONL records, this can plausibly explain a 30-40 GB app-server footprint.
thread/listnormally preserves scan-and-repair behavior unless state DB-only is requested
codex-rs/app-server/src/request_processors/thread_processor.rsacceptsuse_state_db_onlybut defaults it through from the client params.codex-rs/thread-store/src/local/list_threads.rscallsRolloutRecorder::list_threadswhenuse_state_db_onlyis false, and only callslist_threads_from_state_dbwhen true.- The protocol schema notes that
useStateDbOnlyskips scanning JSONL rollouts to repair thread metadata, which suggests the default thread list path can still touch rollout files. - The list summary path appears more bounded than full history loading, but it is still part of the startup/listing hazard for pathological rollouts.
Expected behavior
A pathological local rollout should not be able to make the app-server consume tens of GB. Suggested guardrails:
- Refuse, truncate, quarantine, or summarize-only any rollout above a sane byte/record threshold for UI list/read/resume operations.
- Make
thread/listuse state DB-only by default in the desktop app when state DB is available, or repair in a bounded background job. - Make
thread/read include_turns=trueenforce a byte/record budget and return a clear error or partial/summarized history instead of loading the whole rollout into memory. - Add memory/size telemetry around rollout replay/list/repair paths.
- Consider clamping or treating impossible token counts (for example ~2B tokens) as corrupt/outlier state.
Reproduction shape
I do not have a minimal synthetic repro yet, but the local state suggests this shape:
- Have a very large rollout JSONL under
~/.codex/sessions(observed: 11.88 GiB, 84,643 lines, individual lines up to ~60.9 MB). - Ensure state DB references the thread and contains an extreme token count.
- Restart Codex Desktop.
- Open the thread list and/or read/resume the pathological thread with turns/history included.
- Observe
/Applications/Codex.app/Contents/Resources/codex app-server --analytics-default-enabledmemory grow to 30-40 GB and swap climb into tens of GB, or observe the app-server abort/crash withSIGKILL.
What would help users immediately
A small safe-mode/quarantine behavior would be very helpful: if Codex detects a rollout above a threshold during startup/list/read/resume, skip full replay, show a recoverable warning, and avoid loading that file into app-server memory.
Activity
github-actions commentedon Jun 23, 2026
Potential duplicates detected. Please review them and close your issue if it is a duplicate.
Powered by Codex Action
pdh0826 commentedon Jul 14, 2026
Still reproducible on a newer Codex Desktop release, with an even larger local rollout. This appears to be the same failure mode.
Environment
26.707.62119codex-cli:0.144.215.7.4(24G517), arm64Observed behavior
codex app-serverlaunched at10:05:13and reached26-27 GBby about10:14.27.19 GB;samplereported a32.7 GBpeak.footprintcapture while memory was high reported about23 GBphysical footprint, including about21 GBdirty inMALLOC_MEDIUMand832 MBinMALLOC_LARGE.codexprocess.12 GBin the compressor and only roughly167-300 MBunused during captures.Correlated local state
I checked file metadata only and did not inspect or upload transcript contents.
29,138,057,205bytes (about27.1 GiB)2026/07/05session directory and was last modified on2026-07-14 10:01:22 +0900.2.17 GB,1.34 GB, and1.17 GB.A 3-second live process sample while the problem was occurring showed a Tokio worker in async file reading plus repeated JSON parsing/copy/allocation paths, including:
tokio::fs::file::File as AsyncRead::poll_readserde_json::read::StrRead::parse_str_realloc,_platform_memmove, andvm_copyThis strongly matches the unbounded rollout hydration described in this issue. The especially important regression signal is that the problem remains present in Desktop
26.707.62119/ CLI0.144.2, and restart alone immediately reproduces it because the oversized rollout is loaded again.No session contents, usernames, project paths, or private logs are included here.
YoungMoneyInvestments commentedon Jul 17, 2026
Confirming this on macOS 26.5 (M-series), ChatGPT.app 26.707.72221 / codex-cli 0.144.2 — reproduced on two different MacBook Pros, so it's not machine-specific.
Measurements tonight:
codex app-serverprocess, 18h uptime → 77 GB footprint (footprint -p), swap 52/53 GB full, macOS 'out of application memory' dialogs.~/.codex/sessionsheld 1,637 rollout .jsonl files (2.1 GB). Closing sessions in the UI frees nothing — everything lives in the single long-lived app-server heap.Note for anyone diagnosing via Force Quit dialog: ChatGPT and Google Chrome can show identical multi-GB values (we saw both at exactly 17.98 GB) — that's shared Chromium-framework memory double-counted (the Codex renderer maps ~1.9 TB virtual). Check per-process RSS/footprint before trusting it.
Workarounds that held for us:
~/.codex/sessionsfiles older than 14 days elsewhere (2.1 GB → 528 MB here).codex app-serverprocess when its footprint exceeds ~12 GB — ChatGPT.app stays open and respawns it on next use, so this is far less disruptive than restarting the whole app.Would love a real fix: cap/stream rollout history loading and tool output instead of accumulating it in the app-server heap.
teamleaderleo commentedon Aug 10, 2026
Confirming this on a current ChatGPT/Codex Desktop build:
26.803.41515build6321codex-cli 0.147.0-alpha.6.526.5.1 (25F80)arm64The affected process was:
macOS recorded a 16 GB peak physical footprint for app-server. At capture time it was still around 5 GB physical with about 4.7 GB swapped out.
vmmap/footprintshowed multi-GB allocator regions:A one-minute trace kept app-server around 98–136% CPU. A 5-second
samplerepeatedly hit:~/.codex/sessionswas 7.7 GB. The five largest rollout files were:lsofshowed the 2.09 GB and 1.29 GB rollouts open by the affected app-server during the incident, along with a bunch of smaller rollouts.Direct helper children were only about 148 MiB RSS combined, so the multi-GB memory use was in app-server itself.
This looks like the same oversized-rollout hydration path described here: app-server is reading rollout history and doing heavy JSON parsing/allocation while multi-GB rollout files are open.
adamdmcbride commentedon Aug 13, 2026
Corroborating report from a current macOS Desktop build. This is the same failure class, with a remote MCP-output-heavy rollout rather than an image-heavy rollout.
Environment
26.803.61601(build6396)0.147.0-alpha.6.527.0(26A5388g), arm64Sanitized evidence
Desktop repeatedly resumed the same rollout successfully, then the application crashed about 24 seconds later:
There were three app crashes in approximately four minutes. All three macOS reports show:
Two earlier
codex-code-mode-hostreports from the same incident window contain these frames:Those code-mode-host failures may be secondary, but they confirm V8 memory exhaustion was occurring during the same high-output task.
Recovery that worked
tool_output_token_limitconfig setting for future model-visible tool output.After the oversized active rollout was quarantined, the app remained stable for more than two hours with no new crash report.
Secondary local-state observation
logs_2.sqlitewas 4.42 GB, with about 3.72 GB represented by free pages. Because the database uses incremental auto-vacuum, boundedincremental_vacuumplus WAL checkpoints reduced it to about 0.70 GB whilePRAGMA integrity_checkremainedok. This was not the primary trigger, but it added avoidable recovery pressure.Expected guardrails
This incident supports the guardrails proposed here and adds one important case: persisted remote MCP results need byte budgets too, not only shell output, images, or model-visible context.
Suggested fixes:
thread/resumeand load history incrementally.I am intentionally not attaching the raw rollout, full app logs, or unredacted crash reports because they contain private prompts, local paths, and remote API payloads. Three app
.ipsreports and two code-mode-host.ipsreports are available for private upload through the in-product feedback/support path if an OpenAI maintainer wants them.oneles commentedon Aug 19, 2026
Same issue here, but at a much lower trigger threshold — this is not just a heavy-user problem.
I hit this on a 16GB M1 Pro during normal daily use (not a power Codex user). A single
106 MB rollout was enough to make the whole system unusable.
Environment
— 106 MB / 4,613 lines, 6 compactions, 558 tool calls over 15 days
(tiny compared to the 11.88 GiB case, yet triggers the same failure)
Measured impact (12 s sampling while ChatGPT was open)
Key point
The same unbounded loading path (RolloutRecorder::load_rollout_items) triggers at
106 MB, not only at 11.88 GiB. On a 16 GB machine already running VS Code/Edge/etc.,
even one long Codex session is enough to stall the whole system. "Archiving" the thread
in the UI does NOT move the file out of ~/.codex/sessions — the app-server still scans
and loads it on startup (verified: file stays in place after Archive).
Request
Please add the guardrails proposed above: byte/record budget for load_rollout_items,
quarantine oversized rollouts, and state-DB-only thread listing. Happy to provide
more data if useful.
offx366 commentedon Aug 31, 2026
I reproduced the same failure class on Linux with Codex CLI
0.151.0, this time after opening three project sessions against one shared app-server.Sanitized runtime evidence:
quick_check; the trigger was oversized full-history hydration, not SQLite corruptionI prepared a minimal fail-closed patch for the full-history path:
RolloutRecorderloaderInvalidRequestDraft and commit:
GitHub currently prevents this account from creating a PR directly against
openai/codex(CreatePullRequestpermission denied), so the clean branch is published in the fork for maintainer review/cherry-pick. Formatting and diff checks pass; the draft records the CI limitation honestly.I deliberately kept automatic quarantine/migration out of the upstream patch: this change only prevents one pathological thread from taking down the whole app-server and does not modify user history.