Repository navigation
1.5 AOT by default performance tracking issue #8259

Description

Heya all,
When using Angular CLI 1.5 together with Angular 5.0.0, ng serve will default to using --aot=true. We added a new pipeline that should make AOT compilation much faster than it was with older CLI and Angular versions so we felt confident that AOT rebuild speeds should be much better.
Bigger projects can still have slow AOT rebuilds though. You can disable AOT by passing on the --no-aot (or --aot=false) flag, but if you have time I'd also like to ask for your help debugging remaining bottlenecks.
A good way to figure out how time is being spent in a rebuild is via CPU profiles. These show what functions are being called and how much time is being spent in each function.
This is how you can capture a CPU profile and share it here:
- Make sure your project is using the following dependencies:
- At least
@angular/cli@1.5.0-rc.8. - At least
@angular/core@5.0.0-rc.9, together with other@angular/*packages. - At least
rxjs@5.5.2. - Exactly
typescript@2.4.2, newer versions might work but this is the latest officially supported by@angular/compiler-cli.
- At least
- Open
chrome://inspect/#devicesin chrome, and then clickOpen dedicated DevTools for Node. This will give you a window calledDeveloper Tools - Node.jsthat we'll get back to in a second. - In your
package.json, add the following NPM script:"debug": "node--max_old_space_size=8192 --inspect --debug-brk ./node_modules/@angular/cli/bin/ng serve"- This script tells node to start Angular CLI with the node debugger, and also to raise the maximum memory limit.
- Run
npm run debug. - The
Open dedicated DevTools for Nodewindow should pop up. It is stopped on the very first line of Angular CLI. Click theResumebutton in the upper left corner of that window:

- Wait until the initial build is finalized.
- Open your apps
main.tsfile, addconsole.log(1);to the end of it and save. Do this 3 times.- Saving a file without code changes won't trigger trigger a real rebuild, we have to actually change code like adding a
console.log. - The first few rebuilds can take longer than others, so we ignore them.
- Saving a file without code changes won't trigger trigger a real rebuild, we have to actually change code like adding a
- Now we will capture the CPU profile of a rebuild:
- Go back to the
Open dedicated DevTools for Nodewindow. - Click the right-most tab, called
Profiler. - Click
Start. - Add another
console.log(1);tomain.tsand save it. - Wait until the rebuild finishes.
- Click the
Stopbutton in the profiler tab. - Wait until
Profile 1shows up on the left, and then click it (opening it can take some time for big projects).
- Go back to the
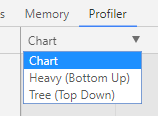
- You should see a chart. Zoom into it until you get all of it in the screen, take a screenshot and post it here.
-
If you don't see a chart, click the dropdown beneath
Profilerand selectChartfrom there.
-
This is how it looks like for a new project:

-
- Right click
Profile 1, clickSave. Upload it somewhere and link it here.- I uploaded it to google drive: https://drive.google.com/open?id=0B06an8Bxmi7URXhhRzMxLWpPQmM
Then I can look at the CPU profile and see where time is being spent on your rebuild. Hopefully I can find new bottlenecks and make your builds faster.
Note: Sometimes the debugger doesn't disconnect after you quit the ng serve process. If you have to do this process more than once and get Unable to open devtools socket: address already in use when running npm run debug, open your process manager and kill any existing Node.js processes.
Activity
elvisbegovic commentedon Oct 31, 2017
@filipesilva thanks to this I will do it right now ! cant wait 40 seconds after each changes :(
aitboudad commentedon Oct 31, 2017
@filipesilva it take ~8 seconds see https://drive.google.com/file/d/0B5h6RmZbETX3WUJYR0JwM3RnZnc/view?usp=sharing
filipesilva commentedon Oct 31, 2017
@aitboudad thanks for posting your profile here! I can get some information out of it but it looks very different from others I've seen.... What node version are you using? Wondering if it's related to that.
filipesilva commentedon Oct 31, 2017
I took a CPU profile of a rebuild from @karptonite's project in #8216 (with his permission). It looks like this:
It can be found here: https://drive.google.com/file/d/0B06an8Bxmi7UWTBOUHY4SVRWNkE/view?usp=sharing
The interpretation of that CPU profile is that the big chunks on the middle/left (the ones that say
AngularCompilerProgram) are part of the AOT compiler. They seem to be taking around 13s total. The two blocks on the left are part of webpack - creating the bundles and emitting them. That is taking about 4s.I'm going to talk to the compiler team to see if something can be done about the
AngularCompilerProgrambits.filipesilva commentedon Oct 31, 2017
@istiti thanks for doing this. 40s is really a long time for a rebuild, can you try using
ng serve --no-aotfor now until we improve/fix the performance of AOT?elvisbegovic commentedon Oct 31, 2017
@filipesilva thanks for theses clear/easy steps but just to be more precise without error/question you should edit your message to have :
"debug": "node --max-old-space-size=8192 --inspect --debug-brk ./node_modules/@angular/cli/bin/ng serve"to avoid JavaScript heap out of memory
and edit step "You should see a chart" because I see :

and neew change view.
And I edit 3 times main.ts writing at end :
console.log(1);-> buildthen console.log(2);-> buildthen console.log(3);-> buildand last one writing
console.log(4);Here's my config :
Here's chart:

And file: https://drive.google.com/open?id=0BzKW4KaSm_QMQXpUWlpmeFh4RVk
please apologizes my ignorance, cant able to read this profile, outside of my skills :)
UPDATE: change npm version was write mistake above
filipesilva commentedon Oct 31, 2017
@istiti thank you so much for this information, I'll edit my comment to reflect the memory flag and the view selector.
Your CPU profile looks a lot like @karptonite's one. Most of the time is spent in emitting files from
AngularCompilerProgram. I'll see what I can do about that.elvisbegovic commentedon Oct 31, 2017
@filipesilva what does this mean, it's on angular side?? do you invite me to make some noises here angular/angular#19337
aitboudad commentedon Oct 31, 2017
v8.6.0filipesilva commentedon Oct 31, 2017
@istiti not necessarily. The CLI might be using the compiler incorrectly and that results in bigger build times. So I have to investigate what's the root cause of the problem, I do not know yet.
aitboudad commentedon Oct 31, 2017
@filipesilva downgraded my node version into
v6.11.5here is file: https://drive.google.com/file/d/0B5h6RmZbETX3NzZ2eEpMLTBHRjA/view?usp=sharingfilipesilva commentedon Oct 31, 2017
@aitboudad ah yes, it seems it was because of the node version... now it looks like the others:
28 remaining items
hccampos commentedon Nov 2, 2017
Since most of the time is spent on
replace, I am guessing something is triggering this http://www.regular-expressions.info/catastrophic.html I will dig deeper, but maybe someone on the Angular compiler team can figure it out quicker. @hansl @filipesilva should I open an issue on the Angular repo instead?fix(@angular/cli): use JIT by default with ng5
filipesilva commentedon Nov 2, 2017
@danwulff there's some discussion about AOT in unit tests on #8007
@diagramatics thanks for taking your CPU profile as well. I had a look at it and it looks very similar to the 'normal' time distribution: 3/4s on AOT, 1/4 on webpack. It's good to get confirmation of these samples 👍
@hccampos I pinged the compiler team about your issue.
pleerock commentedon Jan 10, 2018
@filipesilva looks like there is a confusion between
max-old-space-sizeandmax_old_space_size. I also usedmax-old-space-sizein debugging because I used code from your first post, you need to edit it. I made this found because of @sabeersulaiman post in #5618filipesilva commentedon Jan 10, 2018
@pleerock thanks for heads up, will edit it.
elvirdolic commentedon Apr 16, 2018
Will aot be default on ng serve as promised for v6?
elvisbegovic commentedon Apr 16, 2018
Where is it promised?! afaik it was for 1.5 but not interesting on large project. I heart for v6.x some things about it will come but still’ not default
You could take a look inside bazel from alexeagle repo or https://www.ng-conf.org/sessions/hands-full-stack-development-nx-bazel/
elvirdolic commentedon Apr 16, 2018
elvisbegovic commentedon Apr 16, 2018
Yes, if you read in this thread this comment it was by default one moment but deactivated again because in my project by example it is completly not interesting. check my comment here.
And last news you can read this comment
elvirdolic commentedon Apr 17, 2018
fix(@angular/cli): use JIT by default with ng5
angular-automatic-lock-bot commentedon Sep 8, 2019
This issue has been automatically locked due to inactivity.
Please file a new issue if you are encountering a similar or related problem.
Read more about our automatic conversation locking policy.
This action has been performed automatically by a bot.
fix(@angular/cli): use JIT by default with ng5